The Q&A page includes detailed information on how your customers are interacting with the Q&A Display. Each section of the report is detailed below.
Q&A Interactors
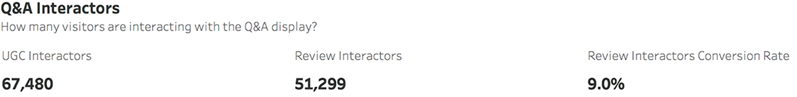
- UGC Interactors - Count of unique visitors to your website that interacted with some form of UGC (reviews, media, or Q&A)
- Q&A Interactors - Count of unique visitors to your website that had an interaction with the Q&A Display
- Q&A Interactors Conversion Rate - Percentage of Q&A interactors that made a purchase
Q&A Sales Influence
The Q&A Sales Influence chart is a powerful visualization for understanding how visitor conversion has been impacted by Media impressions and interactions.
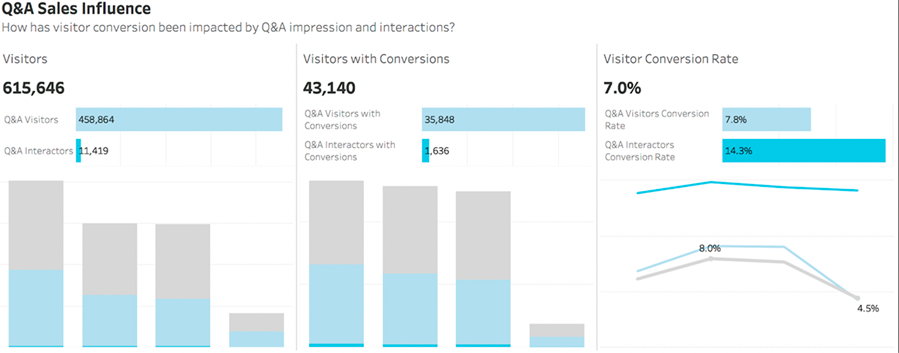
- Visitors - Count of unique visitors to your site (please note a visitor may have multiple sessions and multiple page views per session)
- Q&A Visitors - Count of unique visitors to your website that had an impression on the Q&A Display
- Q&A Interactors - Count of unique visitors to your website that interacted with the Q&A Display
- Visitors with Conversions - Count of visitors that made a purchase
- Q&A Visitors with Conversions - Count of unique visitors to your website that had an impression on the Q&A Display and made a purchase
- Q&A Interactors with Conversions - Count of unique visitors to your website that interacted with the Q&A Display and made a purchase
- Visitor Conversion Rate - Percentage of visitors that made a purchase
- Q&A Visitors Conversion Rate - Percentage of Q&A visitors that made a purchase
- Q&A Interactors Conversion Rate - Percentage of Q&A interactors that made a purchase
Q&A Feature Engagement
The reference line in the Visitor Conversion Rate chart refers to the overall Visitor Conversion Rate (percentage of all visitors that made a purchase).

Below are descriptions and examples of each Q&A feature:
-
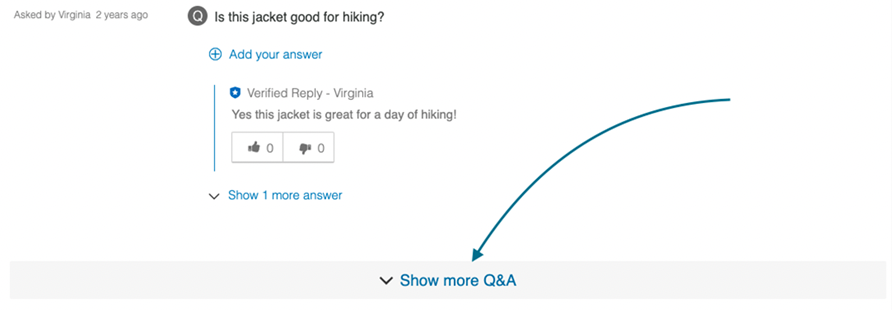
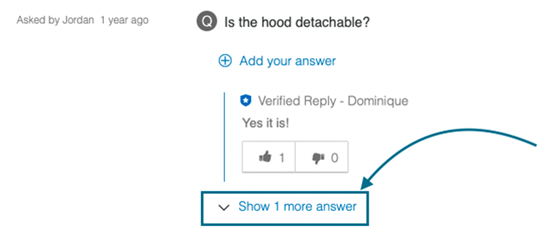
Show More Answers
-
Click Read Answers
-
Ask Question Header
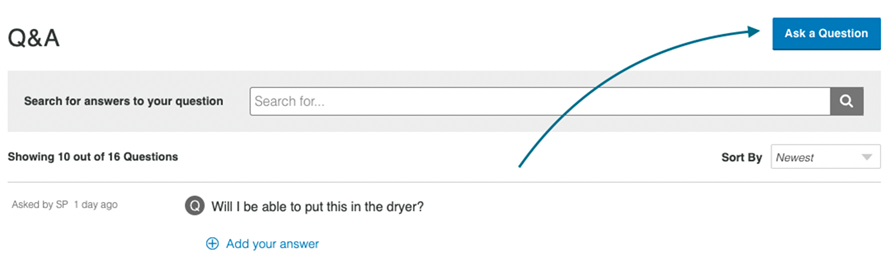
-
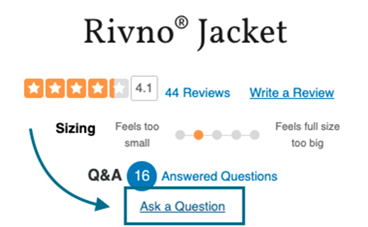
Ask Question Snippet
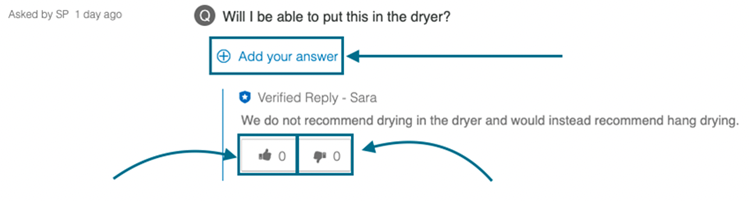
- Answer Question
- Answer Helpful