The Display page includes detailed information on how your current display looks to your customers from a Questions & Answers perspective and how that impacts traffic and conversion on your website. This analysis includes all questions and answers that are currently published on your site. Use the filters to focus on the level of detail that is important to you, such as Brand, Category, or Page ID. The date on this page is always from the perspective of when the question or answer was published, and also considered the date it reached your display page.
Current Display
The Current Display section provides insight into how your display pages look from a Questions & Answers perspective to your customers. It summarizes how many questions and answers you have displayed as well as a breakdown of how those are distributed across your products. The Answerer Type chart breaks down who is answering the questions. The Cumulative Questions chart breaks down how your displayed questions have trended over the last 6 months.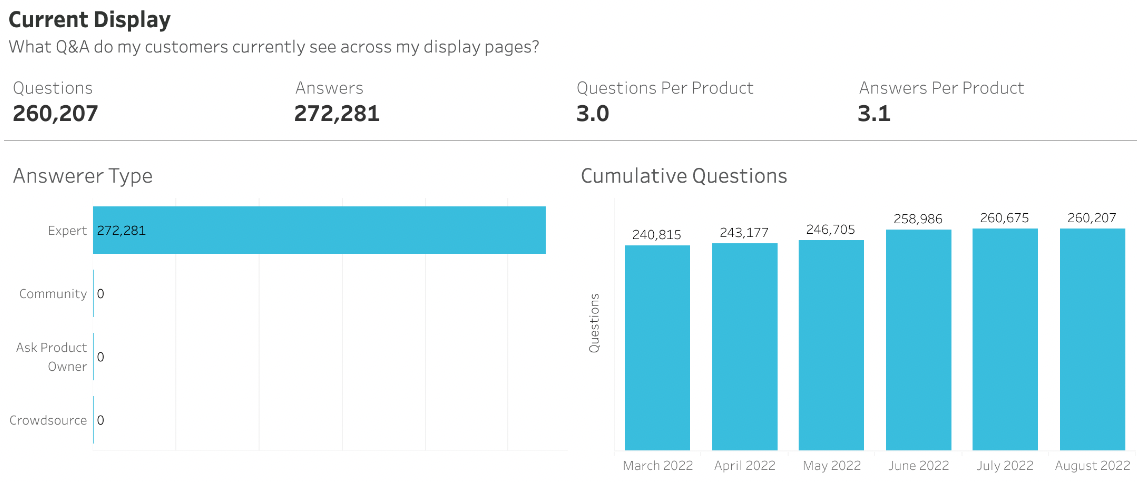
- Questions - Count of questions displayed on your website
- Answers - Count of answers displayed on your website
- Questions Per Product - Average number of questions displayed per product on your website
- Answers Per Question - Average number of answers displayed per question on your website
Coverage
The Coverage section provides a more detailed analysis into how this content is distributed across your product pages and the effect it has on traffic. The amount of content on each page can heavily influence not only the trust a customer has in the product but also the search engine ranking of the page and traffic.
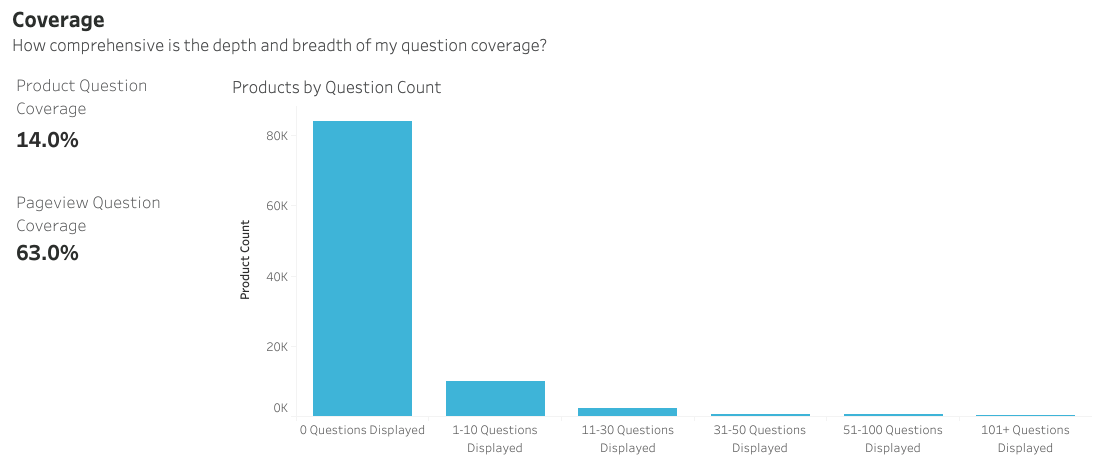
- Product Question Coverage - The percentage of products that have at least one published question
- Pageview Question Coverage - The percentage of pageviews that were on pages with at least one published question