This dashboard shows the performance and trends of the standalone Write-a-Review (WAR) form, including those collected by both fly-by web reviews/email and excluding RYP tracking/Ratings Only collection at this time. Use this dashboard to see how your WAR form is performing by Device, Merchant Group, Merchant, Category, Brand, or Product. This tab also allows you to see how your performance has changed over time.
Write A Review
The number of Form Submits is based on site analytics tracking which relies on the consistent client-side rendering of PowerReviews' JavaScript, and should not be compared with reviews collected.

- Form Submission Rate - The percentage of form starts that end up getting submitted (Form Submits / Form Starts)
- Form Starts - The number of times a WAR form was started in the selected date range
- Form Submits - The number of times a WAR form was submitted in the selected date range
- Average Daily Submits - The average number of forms submitted per day in the selected date range
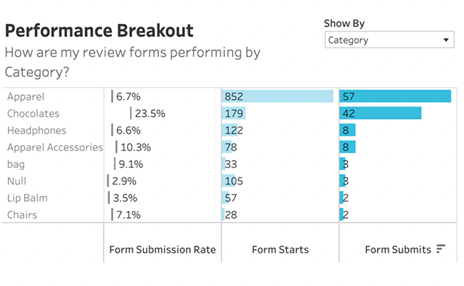
Performance Breakout
The Performance Breakout section shows how your Form Submission Rates, Starts, and Submits differ by Category. You can also use the dropdown to change your breakout to the Merchant Group, Merchant, Brand, or Product level.

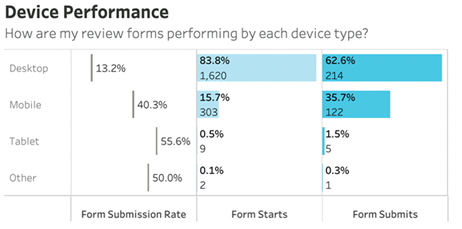
Device Performance
The Device Performance section shows your performance stats by each device type. See which device type most customers are using to write a review and how submission rate differs by each device type.

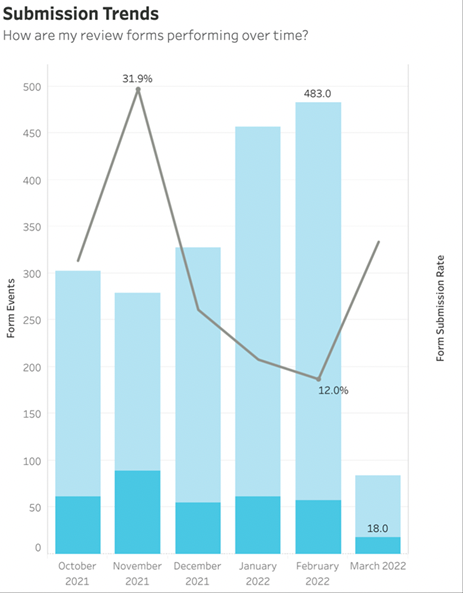
Submission Trends
The Submission Trends section shows how your Form Submission Rates, Starts, and Submits have changed over time. A large dip in a submission rate could be indicative of an issue with one of your form templates.
